1
The easiest tool to profile and analyse a machine's boot sequence is probably bootchart. It will run on all Unix distros and will generate easy-to-read graphs.
Basics on using bootchart on Ubuntu
The bootchart package is available in the Ubuntu repositories, so it can be installed either through apt-get or Synaptic. After you install it, all you have to do to generate your first bootchart is restart (dead easy, eh?!). The graph is stored in /var/log/bootchart as a PNG file. Each bootchart is listed with the hostname, date and a number sorting charts generated on the same day. An example bootchart will look like this:
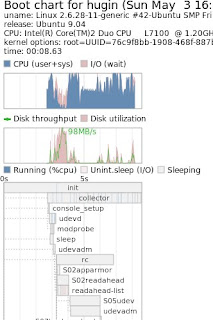
This graphically shows you what your computer is doing in terms of CPU, IO, and processes during the boot procedure. The chart itself contains 4 sections:
-description of the system
-CPU graph
-I/O graph
-a Gantt-like chart showing the details and sequence of the running processes
By default, bootchart stops recording when it has detected gdm has started, so be aware that the resulting charts are unlikely to include the extra time gdm takes to start up and show you a usable desktop. But usually by that point the init is done and the remaining optimizations need to be done in the window manager (Gnome, KDE, XFCE, etc...) rather than in the system init scripts. The most immediately useful purpose of bootchart is to objectively discover the boot time, and where the bottlenecks are. For example, the boot chart below, captured on the same machine with the same OS and parameters shows a total boot time of 14 seconds, which isn't bad, but still almost double than above!!
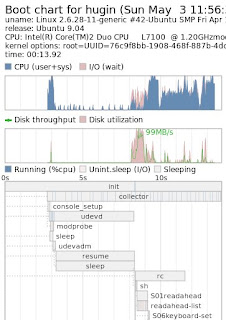
Ideally, you'd want your init to max out the CPU at 100% as much as possible. If the CPU is not pegged at 100% and there is a high I/O wait, that usually means your CPU is idling while it is waiting for the disk to return data. But if your CPU is idle and the I/O are limited, you'd want to investigate... Basically, in the case above, you'll quickly notice a 5 seconds "dead zone", with 2 suspicious processes named "resume" and "sleep". In fact, this 5 seconds delay makes up for most of the difference between the two boot sequences.
So where can they come from and what should be done to optimize the boot time? Well, first you'll notice the 5 seconds sleep occurs before the rc scripts, so no need to fiddle with your startup scripts. Then you'll notice they come in sequence after the console_setup, which points you to the initramfs scripts. Once that is said, the solution is obvious: the "sleep 5" comes from the initramfs script trying to mount the RAM. Having a look at the logs will confirm this and give some indications as to what is failing. This behavior could typically be caused by the fact that you have somehow modified your swap partition (new kernel setup? swap partition resize?) and thus initramfs-tools cannot find the partition through the old UUID...
PS: Once you are done playing with bootchart and with your optimizations, you'll probably want to un-install the package so you don't keep writing PNG files on every boot...
Posted on 5/03/2009 04:51:00 pm by Nicolas and filed under
bootchart,
how-to,
linux,
open source,
tool,
ubuntu
Boot times have become quite a hot topic, especially since the release of Ubuntu 9.04, which emphasised on shorter boot times - "some as short as 25 seconds" as per the official announcement.The easiest tool to profile and analyse a machine's boot sequence is probably bootchart. It will run on all Unix distros and will generate easy-to-read graphs.
Basics on using bootchart on Ubuntu
The bootchart package is available in the Ubuntu repositories, so it can be installed either through apt-get or Synaptic. After you install it, all you have to do to generate your first bootchart is restart (dead easy, eh?!). The graph is stored in /var/log/bootchart as a PNG file. Each bootchart is listed with the hostname, date and a number sorting charts generated on the same day. An example bootchart will look like this:

This graphically shows you what your computer is doing in terms of CPU, IO, and processes during the boot procedure. The chart itself contains 4 sections:
-description of the system
-CPU graph
-I/O graph
-a Gantt-like chart showing the details and sequence of the running processes
By default, bootchart stops recording when it has detected gdm has started, so be aware that the resulting charts are unlikely to include the extra time gdm takes to start up and show you a usable desktop. But usually by that point the init is done and the remaining optimizations need to be done in the window manager (Gnome, KDE, XFCE, etc...) rather than in the system init scripts. The most immediately useful purpose of bootchart is to objectively discover the boot time, and where the bottlenecks are. For example, the boot chart below, captured on the same machine with the same OS and parameters shows a total boot time of 14 seconds, which isn't bad, but still almost double than above!!

Ideally, you'd want your init to max out the CPU at 100% as much as possible. If the CPU is not pegged at 100% and there is a high I/O wait, that usually means your CPU is idling while it is waiting for the disk to return data. But if your CPU is idle and the I/O are limited, you'd want to investigate... Basically, in the case above, you'll quickly notice a 5 seconds "dead zone", with 2 suspicious processes named "resume" and "sleep". In fact, this 5 seconds delay makes up for most of the difference between the two boot sequences.
So where can they come from and what should be done to optimize the boot time? Well, first you'll notice the 5 seconds sleep occurs before the rc scripts, so no need to fiddle with your startup scripts. Then you'll notice they come in sequence after the console_setup, which points you to the initramfs scripts. Once that is said, the solution is obvious: the "sleep 5" comes from the initramfs script trying to mount the RAM. Having a look at the logs will confirm this and give some indications as to what is failing. This behavior could typically be caused by the fact that you have somehow modified your swap partition (new kernel setup? swap partition resize?) and thus initramfs-tools cannot find the partition through the old UUID...
PS: Once you are done playing with bootchart and with your optimizations, you'll probably want to un-install the package so you don't keep writing PNG files on every boot...

Post a Comment